
Lab 4--Vector Analysis Part I and II
This was an interesting and fun lab. It is important to understand the difference between a feature class and shapefile. A feature class resides inside a geospatial database. Though the feature class can contain shapefiles, all elements of a shapefile must have the same geometry (point, line, or area).
An attribute table is a powerful tool that must be learned. An attribute or location query is the starting point to select or exclude specific criteria and modify the feature class to portray the desired results. As an example, a realtor might develop a query to select all houses 500 meters beyond a flood zone (or remove all houses within 500 meters), within 5 miles of a school, and within 10 miles of a fire station. The resulting output produces prospective houses meeting the buyer's criteria. Variations of this function include intersecting features (feature is partially in the area), joining tables (includes features of both tables), and producing compound (multi-ring) or variable buffers (different features have different distances from an area). An alternative to the aforementioned processes is to perform a union.
To produce my final product, I imported database files from the Mississippi Geospatial Clearinghouse. With this data, I could isolate MS counties and select the De Soto National Forest (near Hattiesburg, MS). Not only did I import new feature classes, but I also built my layers, produced buffers, intersections, joins, and exclusions. The resulting map depicts potential campsites in the forest, with selections depicting areas outside the buffer of drain basins, rivers, lakes, sensitive land areas, etc.
I designed the overall map to appeal to outdoor-oriented persons. I added two inset maps to orient the viewer to the location of the National Forest and Perry County. All essential elements of the map were input (north seeking arrow, name/date, credits, scale, neat line, etc.) to ensure the map was easy to read and understand, uncluttered, and accurate.
Specific Map Elements:
--Legend: Displays all features of the map and inset maps with standardized colors.
--Colors:
-Hatched green--potential camp sites (intersection of water/road buffer join and sensitive areas).
-Blue--all hydrology.
-Black lines--Roads
-Red--Perry County
-Pink--De Soto National Forest
--Map Scale: Specific for each map based on most effective display.
--Scale Bar: Even number of kilometers (projection based on meters) and suitable for the size of the area.
--North Area: Map north. I did not use true north because I would have had to have a different arrow for each map or the maps may have been rotated in odd directions. Map north is easier to view and understand.
--Titles: Explain the purpose of the overall map and the location.
Though this lab continues to build proficiency, there are some lessons:
--Always ensure your selections are cleared before executing another selection-type process.
--Make sure your drawing order is arranged properly so you can modify features on a particular layer.
--Be prepared to change your database format in the event that it is wrong or outdated (File>Options or Metadata>Update, respectively).
--When modifying a feature class, make a copy (and rename it) so its original content can be added to another layer.
--Once you begin making your map, do not move your database files or rename them. Your map will be affected negatively. Be careful on what files you delete as some may be more necessary than you thought.
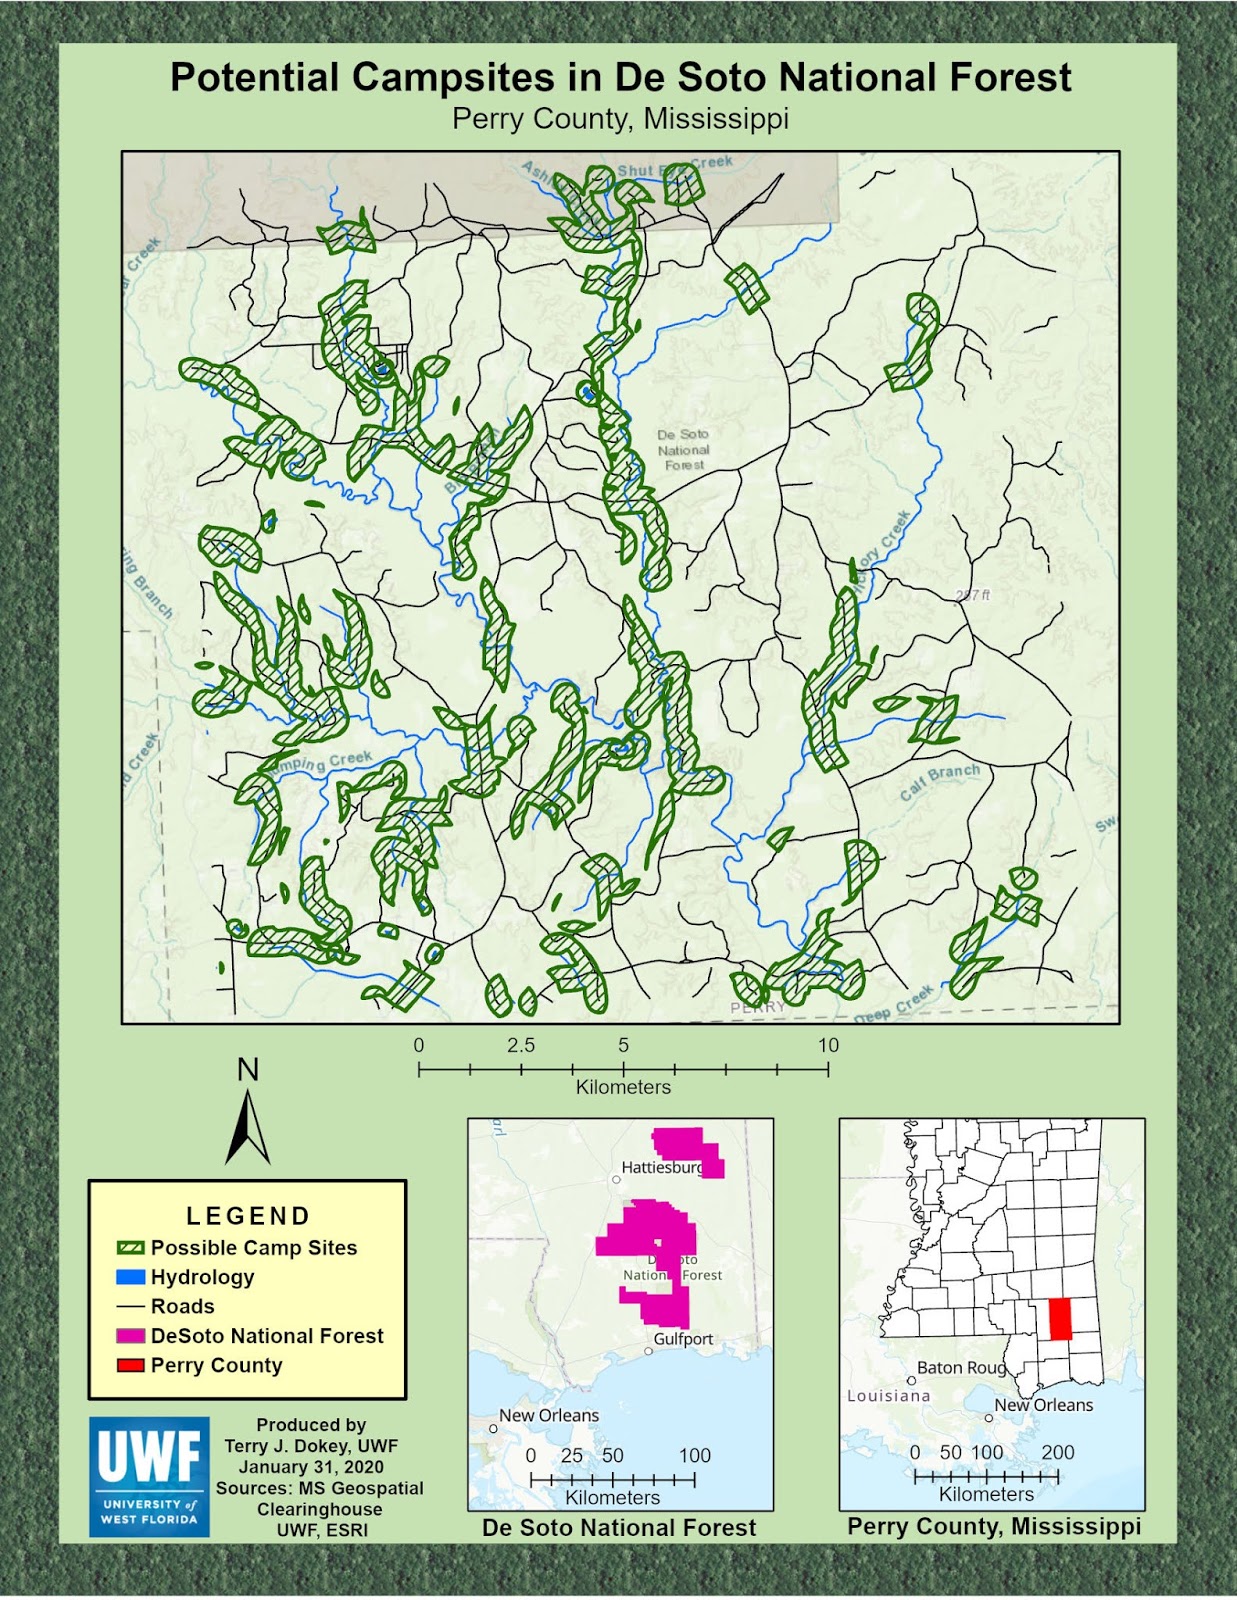 |
| Lab 4--Vector Analysis Lab Showing Potential Campsites within the De Soto National Forest, Hattiesburg, MS. |


No comments:
Post a Comment